
For facility managers across India, from the humid tech parks of Bangalore to the industrial belts of Chennai, efficiency is often chased through expensive chiller upgrades or chemical overhauls. Yet, the most critical indicator of your system’s health is usually sitting in plain sight, unmonitored: the Approach Temperature.
If you aren’t tracking your approach, you aren’t just losing cooling capacity; you are bleeding operational capital. In an era where energy costs are skyrocketing and “Net Zero” is no longer a buzzword but a mandate, understanding the physics of your heat rejection is the difference between a high-performing asset and a financial liability.
1. Defining “The Approach”: The Physics of the Floor
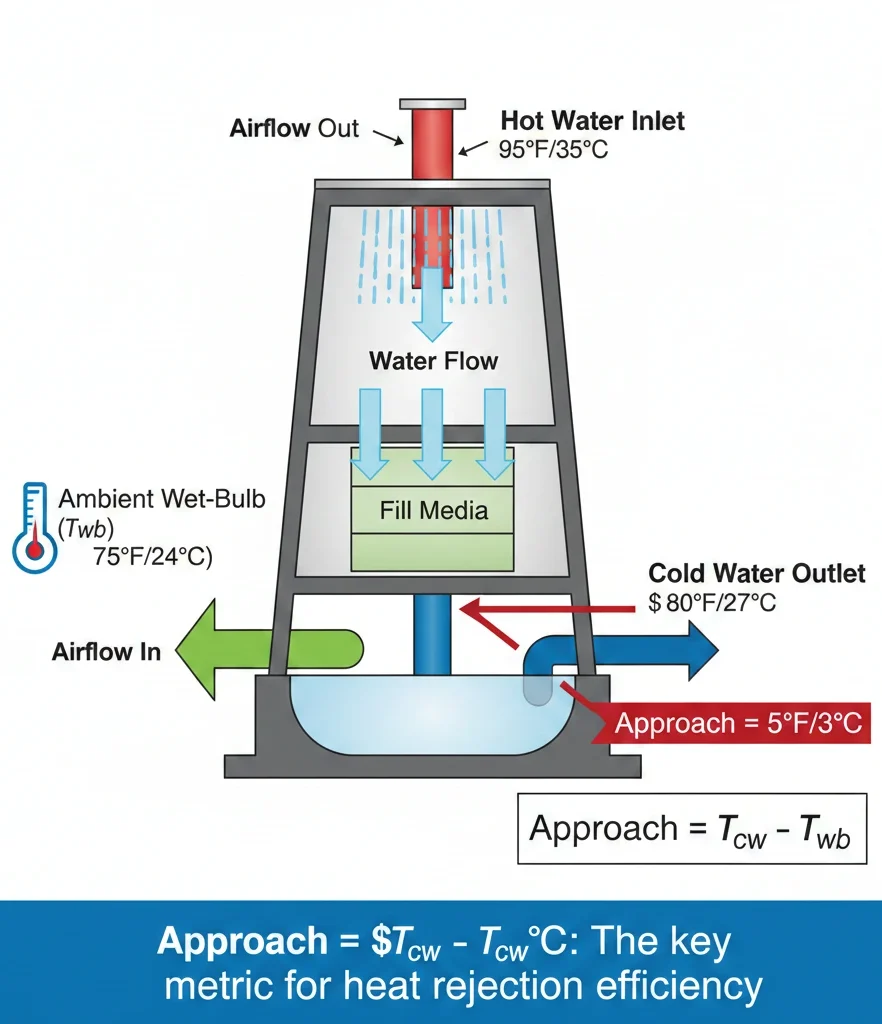
In the world of evaporative cooling, the laws of thermodynamics set a rigid boundary. The Approach Temperature is the delta between the cold water temperature leaving the tower ($T_{cw}$) and the ambient wet-bulb temperature ($T_{wb}$) of the entering air.
Table: $$Approach = T_{cw} – T_{wb}$$
The Wet-Bulb Supremacy
The wet-bulb temperature represents the absolute theoretical limit of evaporative cooling. Unlike the dry-bulb temperature (the “regular” temperature we see on a thermometer), the wet-bulb temperature accounts for humidity. It is the temperature a parcel of air would reach if it were cooled to saturation (100% relative humidity) by the evaporation of water into it.
A cooling tower can never, under any circumstances, cool water to a temperature below the ambient wet-bulb. As $T_{wb}$ rises (a common occurrence during the Indian monsoon), the “floor” moves up, putting immense pressure on your system’s ability to reject heat. If your wet-bulb is 28°C and your tower is designed for a 4°C approach, your cold water will be 32°C. You cannot fight this physics with hope; you must fight it with surface area and airflow.
The Law of Diminishing Returns
While a $0^\circ\text{C}$ approach is a physical impossibility, the cost of “chasing the floor” is exponential. Moving from a $5^\circ\text{C}$ approach to a $3^\circ\text{C}$ approach doesn’t just require a slightly faster fan; it can require doubling the tower’s physical footprint, increasing fill volume, and significantly higher capital expenditure (CapEx). Precision engineering from AadTech India ensures you find the “Goldilocks Zone”—the specific point where the energy savings from your chiller justify the capital cost of the cooling tower.
2. Why it Matters: The Chiller Connection
A cooling tower does not operate in a vacuum; it is the heat-rejection partner for your chiller. The chiller’s job is to move heat from your building into the condenser water loop. The tower’s job is to dump that heat into the atmosphere. When the tower fails to maintain a tight approach, the condenser water entering the chiller is warmer than it should be.
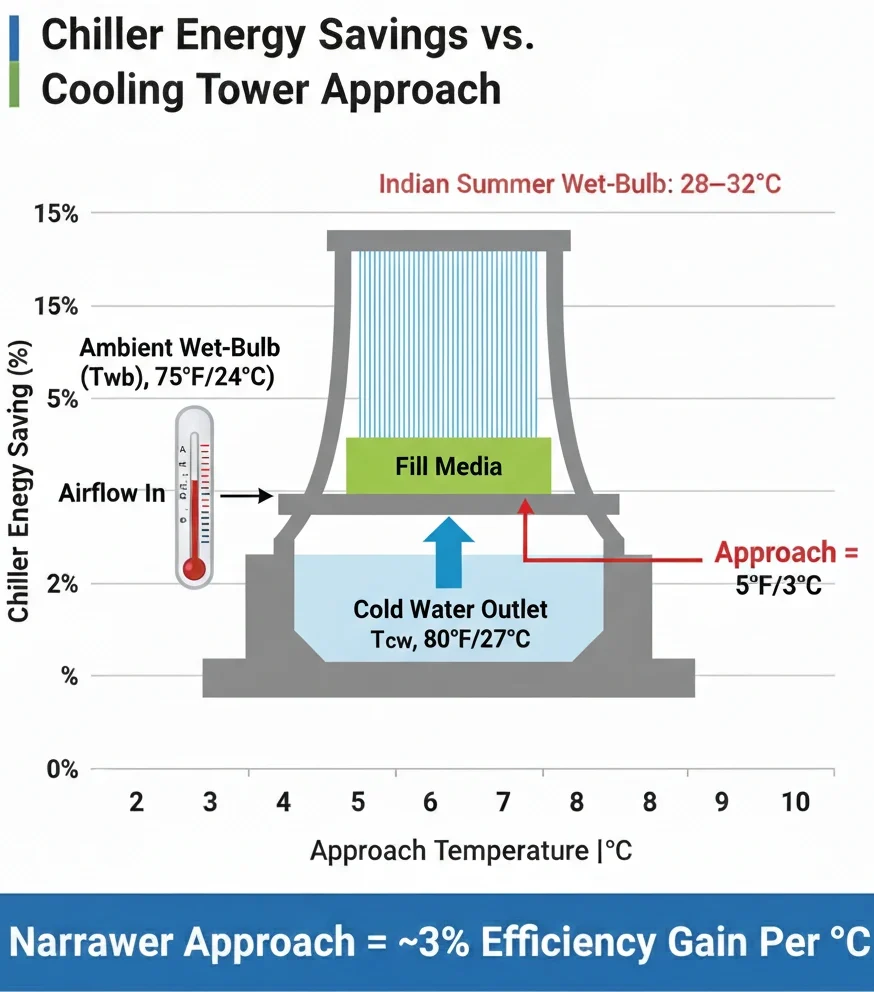
The 3% Efficiency Rule
The math is brutal but simple: For every $1^\circ\text{C}$ decrease in the condenser water temperature, chiller efficiency improves by approximately 3%.
Consider a facility operating a 1,000-TR chiller plant. If a neglected cooling tower allows the approach to widen by just 2°C, the chiller efficiency drops by 6%. Over a year of 24/7 operation, this translates to lakhs of rupees in wasted electricity.
Head Pressure and Mechanical Fatigue
When approach temperatures climb, the chiller’s compressor must work against higher Head Pressure to reject heat. High head pressure is the leading cause of “surging” in centrifugal chillers. It is a violent phenomenon that creates massive mechanical stress on bearings and seals. By narrowing your approach, you aren’t just saving energy; you are extending the life of your most expensive HVAC asset.
3. Performance Killers: What Widens the Gap?
If your approach temperature is drifting away from its design spec, your system is crying for help. In our audits across India, we see three recurring culprits that artificially widen the approach:
Scale and Biofilm: The Invisible Insulator
The fill media is the “lungs” of the cooling tower. Its job is to create maximum surface area for water and air to interact. However, Indian water conditions are notoriously complex. Even a microscopic layer (1mm) of calcium carbonate scale or organic biofilm on the fill acts as a thermal insulator. The demerit is that it prevents the heat from leaving the water, forcing the approach to widen. If your fill is fouled, no amount of fan speed will fix your approach.
Stagnant Air-to-Water Ratios
Cooling is a mass transfer process. You need a specific volume of air to absorb a specific amount of heat from the water. Many older towers in India use belt-driven fans that suffer from slippage or misaligned blades. If your fans aren’t moving the precise volume of air required, the tower cannot “strip” the heat fast enough.
Explore further: See how upgrading to precision EC fans stabilises your cooling tower approach, improves heat rejection, and unlocks measurable energy savings through real-time airflow control.
Plume Recirculation: The Silent Saboteur
Poor tower placement or the addition of nearby structures can cause “plume recirculation.” This happens when the hot, saturated air exhausted from the top of the tower is sucked back into the air intakes at the bottom. It artificially inflates the local wet-bulb temperature. Your tower might think the ambient wet-bulb is 27°C, but if it’s “breathing” its own exhaust, the effective wet-bulb at the intake could be 31°C. The result? A massive, unexplained spike in approach temperature.
4. The Digital Leap: IoT Integration and EC Telemetry
The era of “annual maintenance” is dead. In a high-stakes facility, whether it’s a data centre in Mumbai or a pharmaceutical lab in Hyderabad, waiting for an annual descaling is a recipe for operational failure. AadTech India positions you at the forefront of Condition-Based Maintenance (CBM).
Moving Beyond Manual Logs
Most facilities still rely on manual logs where a technician records temperatures once every few hours. These logs rarely capture the dynamic relationship between wet-bulb shifts and approach drift.
By integrating high-efficiency EC motors with real-time IoT sensors, we continuously track $T_{cw}$ and $T_{wb}$ with high fidelity. Our telemetry systems calculate the “Approach Drift” every minute. If the sensors detect a $0.5^\circ\text{C}$ drift that isn’t explained by weather changes, our AI-driven platform identifies the likely cause (be it a pump flow issue or fill fouling), long before it leads to a high-pressure chiller trip.
5. Local Context: The Indian Climatic Challenge
In cities like Bangalore, the diurnal temperature range is significant. A tower that performs perfectly at 10:00 AM might struggle at 3:00 PM. In coastal cities like Mumbai, the high humidity means the wet-bulb temperature is often very close to the dry-bulb temperature, leaving almost no “room” for error in the approach.
Understanding your local psychrometric chart is essential. A design approach of 4°C in a dry climate like Delhi is a different engineering challenge than 4°C in the humid air of Kolkata. AadTech India’s precision performance audits take these local variables into account, ensuring the optimisation of your tower for the specific “micro-climate” of your rooftop.
Frequently Asked Questions
Typically, 3–6°C (2.8–5.5°C design target) is considered standard for commercial HVAC. However, process cooling applications might require much tighter approaches. The “right” approach is one in which the cost of the tower and the fan’s energy consumption are balanced against the chiller’s power consumption.
Only to a point. Every tower has a “choke point.” Once you reach the maximum design airflow for the existing fill media, increasing fan speed consumes energy exponentially while yielding negligible cooling gains. At this point, the solution is usually a fill upgrade or a larger tower.
Absolutely. High humidity raises the wet-bulb temperature. Since the wet-bulb is the “floor,” a humid day makes it significantly more challenging for the tower to maintain a tight approach. This is when systems with poor water treatment or ageing fill typically fail.
Scale reduces the active surface area where evaporation occurs. It also creates air resistance, making the fan work harder for less airflow. It is a double-whammy: it increases the approach and simultaneously increases fan power consumption.
Ambient wet-bulb ($T_{wb}$) temperatures usually peak in the afternoon as the sun heats the ground and moisture evaporates. This is when your system faces its maximum thermal load. If your approach widens significantly in the afternoon, it’s a sign that your tower is undersized or fouled.