
If you have ever stood in a plant room looking at a running fan and wondered whether it is truly delivering what the design promised, you are not alone. On paper, airflow numbers look neat and predictable. In real life, duct bends, filters, dampers, and changing loads tell a very different story. This is exactly where fan curves become useful, even if they sometimes feel intimidating at first glance.
A fan curve is not just a technical chart. It is a practical tool that tells you how a fan will behave once it is installed inside an air handling unit, not just how it performs in a laboratory test.
How Fan Curves Translate Into Real Performance?
Airflow and Pressure Move Together
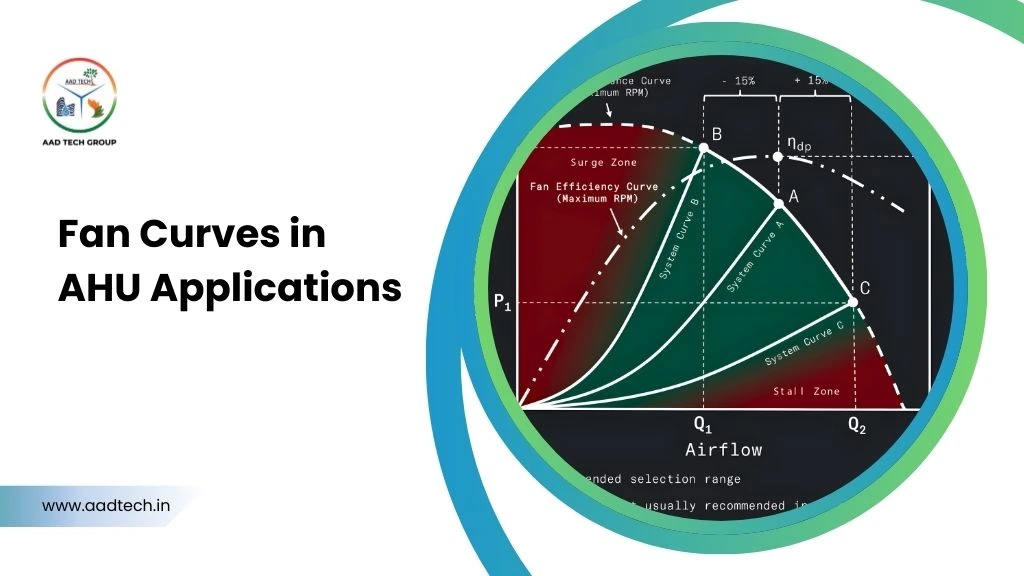
At its simplest, a fan curve plots airflow against pressure. As airflow increases, the pressure the fan can generate usually drops. When people first see this relationship, they often ask why a fan cannot deliver the same airflow at every pressure level.
The answer lies in energy transfer. Moving larger volumes of air requires more energy, and resistance in the system naturally limits how much pressure the fan can sustain.
Power and Efficiency Zones Tell the Real Story
Fan curves also display power consumption and efficiency regions. These zones indicate where the fan operates most efficiently and where energy losses begin to rise.
Selecting a fan that operates near its peak efficiency zone reduces operating cost, noise, and mechanical stress, which becomes especially important in continuous-duty applications.
What Role Does the System Curve Play?
Every Duct System Creates Resistance
A fan curve alone does not predict real performance. Every duct network creates resistance from friction, bends, filters, coils, and dampers. This resistance forms what is known as the system curve.
As airflow increases, resistance rises. The intersection of the fan curve and system curve defines the actual operating point of the system.
Why Mismatched Curves Cause Problems?
If the system resistance was underestimated during design, the fan may never reach its target airflow. If resistance was overestimated, the fan may operate inefficiently.
Many performance complaints trace back to this mismatch rather than mechanical failure.
Why Real AHU Conditions Shift Performance?
Filters, Dampers, and Density Changes
Fan curves are generated under controlled test conditions. In real installations, filters gradually load with dust, dampers modulate airflow, and air density changes with temperature and humidity.
These factors shift the system curve over time, even if the fan itself remains unchanged.
Why is Monitoring Important After Commissioning?
Operators often notice airflow changes months after startup and wonder what changed. In many cases, system resistance has increased quietly due to normal operation.
Understanding this helps maintenance teams diagnose issues without unnecessary part replacements.
Choose Efficiency Over Oversized Airflow
Selecting a fan solely for maximum airflow often leads to poor efficiency. Oversized fans operate inefficiently and create instability, while undersized fans struggle to meet demand.
Balanced selection keeps the fan operating in its optimal zone during most operating hours.
Notice Fan Curves for Troubleshooting
By measuring actual airflow and pressure and comparing them to the fan curve, engineers can determine whether performance issues originate from system restrictions, control settings, or fan limitations.
This structured approach reduces trial-and-error maintenance.
Discover our blog on choosing AHU fans for efficiency and stability
Why This Matters A Lot in Industrial Facilities?
In industrial environments, airflow affects dust control, temperature uniformity, moisture balance, and product quality. An industrial air handling unit often operates continuously, making small inefficiencies accumulate into meaningful energy and reliability impacts.
Understanding fan curves supports more stable and predictable operations over the system’s lifecycle.
Conclusion
Fan curves often appear abstract until they are connected to real operating behaviour. Once that connection is made, they become one of the most practical tools available for improving airflow reliability, energy efficiency, and system stability.
Whether you are commissioning a new air handling unit, diagnosing airflow inconsistency, or planning a retrofit for an industrial air handling unit, understanding how fan curves interact with system resistance allows decisions to be guided by evidence rather than assumptions. It reduces overdesign, prevents long-term inefficiencies, and strengthens operational confidence.
So, we approach airflow solutions by studying how systems actually behave under real conditions, not just how they perform on specification sheets. This allows us to design and optimise systems that remain stable, efficient, and dependable throughout their working life.
Frequently Asked Questions
A fan curve shows how airflow, pressure, power, and efficiency relate to each other for a fan.
It represents duct resistance and determines the fan’s real operating point.
Yes, filter loading, damper changes, and air density shifts affect operating behaviour.
They help identify whether issues come from the fan or system restrictions.
Yes, they support performance optimisation and long-term reliability.