
Industrial cooling towers mask massive auxiliary power waste behind stable cold-water temperatures. Stable outlet temperatures do not mean affordable operation. Equipment decay is a slow bleed from scale buildup, aerodynamic drag, and oversized drives.
Engineering an upgrade requires a forensic audit of psychrometric performance and mechanical power draw.
Deconstructing the Thermodynamic Baseline
Key thermodynamic metrics govern cooling tower capability:
Standard mechanical-draft units yield 70%–75% efficiency. Below this indicates thermal degradation or airflow starvation.
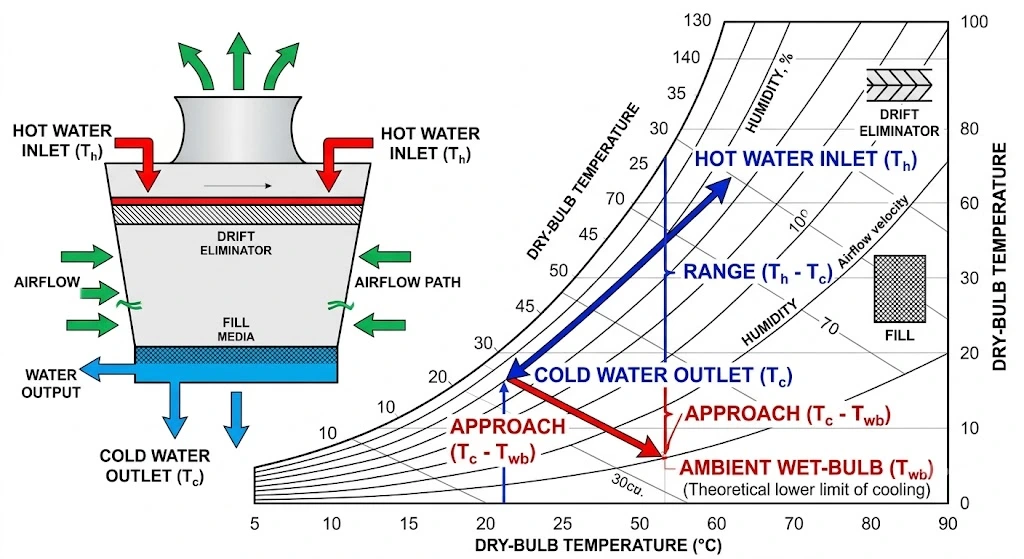
Cooling Tower Thermal Dynamics Schematic
The Auxiliary Power Sink: Exposing Parasitic Losses
Fans represent the largest controllable electrical load in induced-draft systems. OPEX spikes typically stem from mechanical transmission losses.
Uniform air velocity across fill media is non-negotiable. Dead zones force overtime work for nominal cooling.
Legacy belt-driven fans bleed 5%–15% motor energy via friction and belt slip. Direct-drive removes this hidden tax.
The Paradigm Shift: AC Induction vs EC Fan Arrays
Legacy AC motors run at fixed speeds or use external VFDs, resulting in efficiency drops at partial loads.
EC motors integrate the drive into the stator, preserving peak efficiency across variable operation.
Part-Load Advantage
When auxiliary power bills climb, benchmark your mechanical setup by reviewing Aadtech’s technical brief on HVAC retrofits. Leading facilities conduct thorough airflow analysis and site audits to validate energy savings before turning a single bolt.
| Parameter | AC Fan | EC Retrofit |
| Motor Efficiency | Lower (Induction) | Higher (Permanent magnet) |
| Speed Control | External VFD | Integrated |
| Part Load | Moderate | Excellent |
| Maintenance | Higher | Lower |
| Energy Savings | Limited | 20%–60% |
Diagnosing Mechanical Decay
Psychrometric Precision: Leveraging advanced engineering assessments (such as Aadtech’s psychrometric and airflow optimisation studies) ensures that localised heat loads and seasonal humidity shifts are accurately factored into your baseline before approving equipment changes
The Forensic Checklist: CAPEX Audit Protocol
Pull empirical data across three vectors:
Thermal Diagnostics:
– Log hot-water inlet, cold-water outlet, and ambient wet-bulb temperatures
– Install flow meters on make-up and blowdown lines to calculate water loss.
– Measure water flow rate (GPM/LPM or m³/h) for heat balance verification.
– Compare rated/design approach vs. calculated actual approach.
Airflow Verification:
– Measure fan discharge velocity, check static pressure drops, inspect fill/drift eliminators, and verify water distribution
Water Quality Assessment:
– Measure pH (6.5–8.5), conductivity, hardness, and TDS.
– Monitor cycles of concentration (COC) to optimise blowdown.
Retrofit vs Replacement: True ROI
Replacing entire shells is rarely necessary if concrete basins and skeletons remain sound.[
EC fan arrays slash auxiliary power by 20%–60%. Modular swaps take days, not weeks.
Condemn only if the structural framework corrodes beyond integrity. Targeted retrofits deliver faster, lower-risk payback.
5 Key Takeaways
- Approach vs Temp: Stable outlet masks energy waste; benchmark approach against wet-bulb.
- Belt Penalty: Belt-driven fans bleed up to 15% motor power.
- EC Power: Integrated arrays eliminate VFD losses and maintain peak efficiency.
- Physical Inspection: Fouled fills cause localised channelling, destroying capacity.
- Preserve Basin: Sound shell = EC retrofit yields faster CAPEX return.
- Gearbox Friction: Mechanical gearboxes introduce high frictional losses and require constant lubrication; eliminating them via direct-drive EC motors significantly increases system longevity.
FAQs
Eliminate parasitic mechanical losses (replace belt-driven fans), maintain uniform airflow with EC fan arrays, eradicate scaling through regular cleaning, and optimise water distribution by replacing clogged nozzles.
The cooling tower efficiency formula is:
Efficiency=(Range/Range+Approach)
This formula calculates the thermal performance percentage by measuring how close the cold-water outlet temperature comes to the ambient wet-bulb temperature (the theoretical minimum cooling limit). A higher efficiency percentage indicates better performance.
Yes. Fan power represents the largest controllable electrical load in mechanical-draft cooling towers, often determining the facility’s total auxiliary energy overhead. Inefficient fans directly increase operating costs and can strain the plant’s power distribution system.
Yes, if the structural framework and cold-water basin are solid. EC retrofits minimise downtime (days vs weeks) and deliver faster ROI (1–3 years vs 3–7 years) while achieving 20–50% energy savings.
Healthy industrial mechanical-draft towers operate between 70%–75% thermal efficiency. Drops below this baseline indicate mechanical failure or aerodynamic degradation.